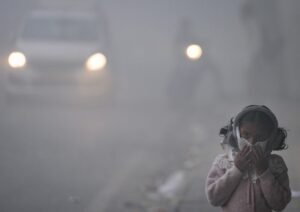
Amid questions over discrepancies between air quality readings reported by the Central Pollution Control Board (CPCB) and private air quality monitoring platforms during the post-Diwali period, the pollution watchdog has defended its methodology, maintaining that differences in AQI figures are due to variations in measurement techniques and averaging periods, and not under-reporting.In a statement issued on Tuesday, the CPCB acknowledged that monitoring technology had advanced considerably since 2015 and said it was reviewing its methodology. Internal deliberations and consultations on processing data beyond the existing system’s measurement range were under way.The CPCB said the National Air Quality Index (NAQI), launched in 2015, was designed to communicate the likely health implications of prevailing air pollution levels. It emphasised that the air quality category and its associated health advisory were more significant than the corresponding numerical AQI value.Addressing concerns over the index being capped at 500, the CPCB said this was a deliberate feature of the methodology introduced in 2015 and was consistent with international practices, including the US Environmental Protection Agency’s AQI scale.An AQI of 500 or above represents the highest level of health concern and falls in the ‘Severe’ category. At this level, air pollution may cause respiratory effects even among healthy people and serious health impacts among those with lung diseases. Beyond 500, the index remains in the ‘Severe’ category, as any further increase would not change the assigned health impact category, it said.Responding to concerns over data gaps at monitoring stations during extreme pollution episodes, the board said particulate matter analysers installed when the NAQI was introduced were calibrated for a measurement range of 0–1,000 micrograms per cubic metre. Under the automated data validation system, hourly readings exceeding this calibrated range were treated as being outside the measurement range and excluded from calculations.Such instances, including occasional bursts of firecrackers on Diwali, could appear as data gaps at individual stations. The affected hours, however, did not contribute to the 24-hour pollutant average for the station concerned.Explaining the methodology, the CPCB said the NAQI was calculated every hour using eight pollutants — PM2.5, PM10, carbon monoxide (CO), nitrogen dioxide (NO2), sulphur dioxide (SO2), ammonia (NH3), ozone and lead. The overall AQI for an hour was determined by the pollutant with the highest sub-index.The calculation uses average pollutant concentrations over the preceding 24 hours, while eight-hour averages are used for carbon monoxide and ozone. At least 16 hours of data are required to calculate the sub-index, and readings for a minimum of three pollutants, including at least one of PM2.5 or PM10, are necessary.The regulatory authority also explained that the AQI was a measure of exposure over a period of time and not simply a reflection of momentary pollution spikes. Citing the National Ambient Air Quality Standards, 2009, it said prolonged exposure was a more relevant indicator of health risks than short-lived increases in pollution, such as those caused by firecracker bursting.On the differences between CPCB readings and those displayed by private applications, the board said several platforms used data from government and non-government sources, including low-cost sensors that might have limitations in calibration and data quality assurance. Some also applied different pollution concentration breakpoints or calculated AQI using instantaneous hourly readings rather than 24-hour averages.The CPCB said private applications could consequently show higher AQI during brief pollution spikes but might report lower figures when concentrations subsequently declined. The NAQI, in contrast, continued to reflect exposure over the preceding 24 hours, providing a more consistent indication of the likely health impact of sustained pollution.