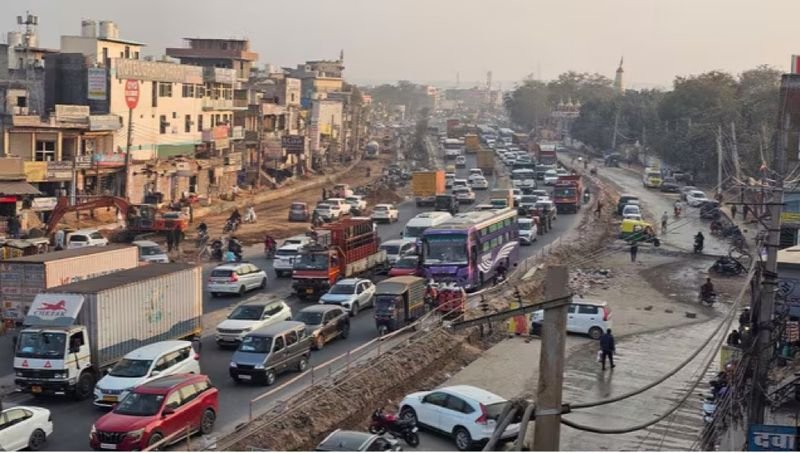

Gurugram commuters struggling with daily traffic jams may soon get some relief, with the Gurugram Metropolitan Development Authority (GMDA) working on a data-driven traffic congestion model based on Pune’s initiative, which uses Google Maps vehicle movement data to identify and address congestion hotspots.Deputy Commissioner Uttam Singh has written to GMDA CEO PC Meena, suggesting the adoption of the model in Gurugram. In a letter dated November 2, he said the Pune City Traffic Police’s initiative had “a direct bearing” on the problems Gurugram faces. He also enclosed the solution provider’s case study.Speaking to The Tribune, the DC said Pune faced traffic issues similar to those in Gurugram, particularly around corporate hubs, but managed them effectively using Google Maps data and other tools.“We really need to incorporate what other cities are doing, not just in India but across the world. We are looking into the nitty-gritties of the Pune model and how we can fit it and use it for Gurugram,” Singh said.Pune Traffic Police began live monitoring of 964 roads in January 2026, with data refreshed every two minutes. The initiative used aggregated probe data from Google Maps’ Roads Management Insights service. The software-only platform required no new cameras, sensors or civil works. Camera coverage in Pune extends to less than 5 per cent of its roads, but the remaining network became measurable within weeks.Every road segment was ranked based on delays against its own baseline for each 15-minute window of the week. About 5 per cent of road links accounted for nearly half of the city’s traffic delays. Chronic bottlenecks were distinguished from incidental congestion through 20 to 30 days of observation.The cause of congestion at each priority junction was then diagnosed, whether it was a bus stop on a flyover approach, a construction-related merge, parking spillover or waterlogging at an underpass.The Traffic Police provided the Pune Municipal Corporation with a junction-level brief for each priority location, detailing its rank, peak hours of disruption, severity, cause, recommendations and a map layer for engineers. Twenty-two junctions and 32 roads were taken up under a multi-agency drive covering the removal of encroachments, retiming of traffic signals and clearing of merges.Pune Police said the average speed on major corridors rose from 20 kmph to 26.8 kmph in two months, an increase of about 34 per cent. The DC noted that these figures were reported by the police and the solution provider and “would need to be independently verified”.The DC wrote that problem junctions in Gurugram were still identified largely through complaints, field assessments by the Gurugram Traffic Police and camera coverage under the Integrated Command and Control Centre. The city has no continuously measured, network-wide baseline to assess the selection of a junction or the impact of an intervention. As a result, requests to engineering agencies are not always backed by data.He added that waterlogging at underpasses during this monsoon, which brought entire corridors to a standstill, had highlighted the importance of acting on forecasts rather than responding after traffic came to a halt.The proposed model is intended to cover roads under the GMDA, the Municipal Corporation and the National Highways Authority of India (NHAI). It could be implemented through the Integrated Command and Control Centre.As a first step, the DC has suggested a pilot project covering 10 to 15 chronically congested junctions. The GMDA and Gurugram Traffic Police would jointly prepare a ranked list of these locations, conduct root-cause diagnoses and prepare junction-level engineering briefs.The agencies concerned would then take up the required works, with the impact measured through before-and-after assessments.